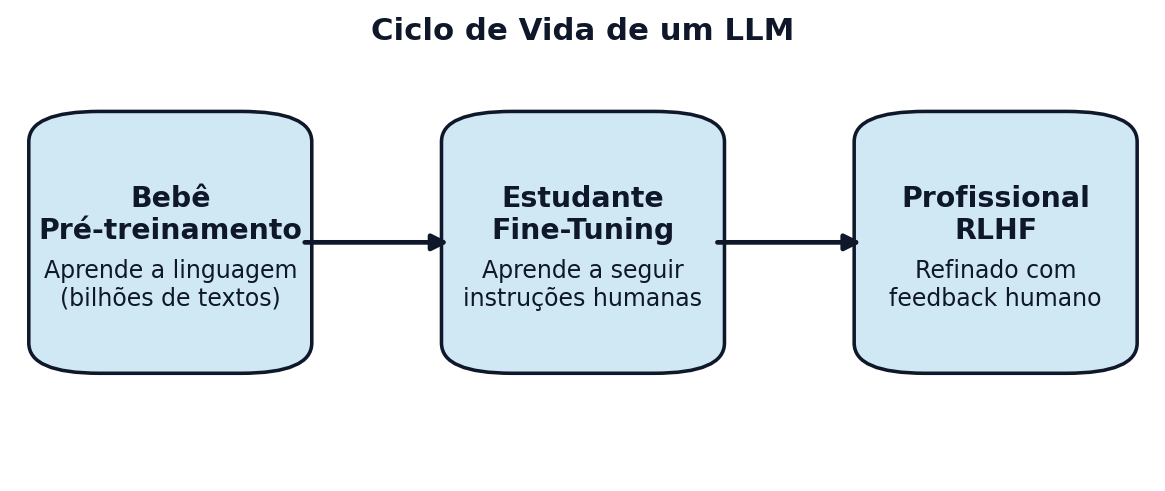
# Diagrama "Ciclo de Vida de um LLM" — versão aprimorada
# - caixas com cantos arredondados + sombra
# - setas consistentes e bem posicionadas
# - hierarquia tipográfica (título em negrito + descrição menor)
# - espaçamento mais confortável
#
# Salva PNG (para navegação web) e SVG (vetorial, nítido p/ impressão)

from pathlib import Path
import matplotlib.pyplot as plt
from matplotlib.patches import FancyBboxPatch, FancyArrowPatch

# ---------- Configurações ----------
OUTDIR = Path("images"); OUTDIR.mkdir(parents=True, exist_ok=True)
PNG = OUTDIR / "llm-lifecycle-v2.png"
SVG = OUTDIR / "llm-lifecycle-v2.svg"

FIGSIZE = (7, 3)   # aumente se quiser mais espaço
DPI = 170

BOX_W, BOX_H = 0.18, 0.46      # largura/altura relativas das caixas
Y = 0.52                        # y central das caixas
GAP = 0.02                      # gap horizontal entre caixas
ROUND = 0.06                    # raio de arredondamento
FACE = "#cfe8f3"                # cor de preenchimento da caixa
EDGE = "#0f172a"                # cor da borda
SHADOW = (0.01, -0.01)          # deslocamento da sombra (x,y)

stages = [
    dict(title="Bebê", subtitle="Pré-treinamento",
         desc="Aprende a linguagem\n(bilhões de textos)"),
    dict(title="Estudante", subtitle="Fine-Tuning",
         desc="Aprende a seguir\ninstruções humanas"),
    dict(title="Profissional", subtitle="RLHF",
         desc="Refinado com\nfeedback humano"),
]

# posições em X para 3 caixas
xs = [0.15, 0.5, 0.85]

# ---------- Funções utilitárias ----------
def add_box(ax, center_x, center_y, w, h, text_title, text_sub, text_desc):
    # sombra (um retângulo atrás, levemente deslocado e translúcido)
    shadow = FancyBboxPatch(
        (center_x - w/2 + SHADOW[0], center_y - h/2 + SHADOW[1]),
        w, h, boxstyle=f"round,pad=0.02,rounding_size={ROUND}",
        fc="black", ec="none", alpha=0.12, zorder=1)
    ax.add_patch(shadow)

    # caixa principal
    box = FancyBboxPatch(
        (center_x - w/2, center_y - h/2),
        w, h, boxstyle=f"round,pad=0.03,rounding_size={ROUND}",
        fc=FACE, ec=EDGE, lw=1.5, zorder=2)
    ax.add_patch(box)

    # textos
    ax.text(center_x, center_y + h*0.12,
            f"{text_title}\n{text_sub}",
            ha="center", va="center", fontsize=12, weight="bold", color=EDGE, zorder=3)
    ax.text(center_x, center_y - h*0.18,
            text_desc,
            ha="center", va="center", fontsize=10, color=EDGE, zorder=3)

def add_arrow(ax, x0, x1, y, shrink=0.014):
    arr = FancyArrowPatch(
        (x0 + BOX_W/2 + GAP, y), (x1 - BOX_W/2 - GAP, y),
        arrowstyle="-|>", mutation_scale=14,
        lw=2, color=EDGE, zorder=4)
    ax.add_patch(arr)

# ---------- Desenho ----------
fig, ax = plt.subplots(figsize=FIGSIZE, dpi=DPI)

# caixas
for (x, st) in zip(xs, stages):
    add_box(ax, x, Y, BOX_W, BOX_H, st["title"], st["subtitle"], st["desc"])

# setas
add_arrow(ax, xs[0], xs[1], Y)
add_arrow(ax, xs[1], xs[2], Y)

# título geral
ax.text(0.5, 0.94, "Ciclo de Vida de um LLM",
        ha="center", va="center", fontsize=13, weight="bold", color=EDGE)

# acabamento
ax.set_xlim(0.02, 0.98)
ax.set_ylim(0.06, 0.96)
ax.axis("off")
plt.tight_layout()

# salvar
plt.savefig(PNG, bbox_inches="tight")
plt.savefig(SVG, bbox_inches="tight")
plt.close()
print(f"Figuras salvas em:\n- {PNG}\n- {SVG}")